Gráficas
Introducción
En ese ejercicio veremos como visualizar los datos en formato gráfico, tanto dentro de un detalle como en las tarjetas
Instalación el módulo de gráficas
Para poder instalar el módulo de gráficas, tenemos que ejecutar el siguiente comando
npm install ontimize-web-ngx-charts --save
Añadir el estilo de las gráficas
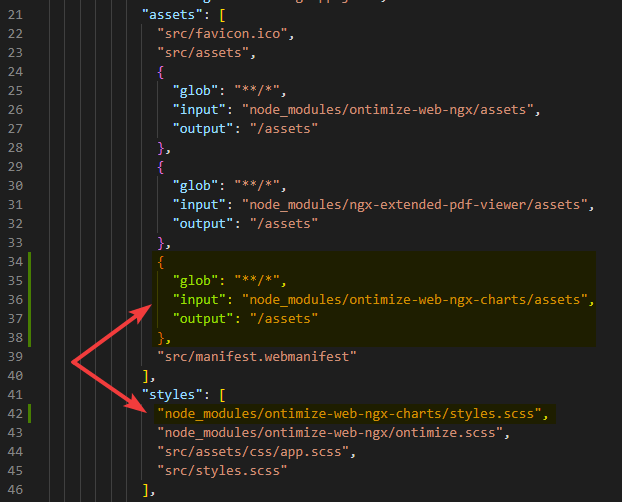
Seleccionamos el fichero angular.json y añadimos dentro del array de estilos el estilo relacionado con el módulo de gráficas
Este array contiene también la entrada para los estilos generales de Ontimize Web, node_modules/ontimize-web-ngx/ontimize.scss
angular.json
...
"assets": [
  ...
  {
    "glob": "**/*",
    "input": "node_modules/ontimize-web-ngx-charts/assets",
    "output": "/assets"
  },
  ...
],
"styles": [
  ...
  "node_modules/ontimize-web-ngx-charts/styles.scss",
  ...
],
...
- ontimize-web-tutorial
- e2e
- src
- app.e2e-spec.ts
- app.po.ts
- protractor.conf.js
- tsconfig.json
- src
- src
- app
- login
- login-routing.module.ts
- login.component.html
- login.component.scss
- login.component.ts
- login.module.ts
- login.theme.scss
- main
- accounts
- accounts-detail
- movement-column-renderer
- movement-column-renderer.component.css
- movement-column-renderer.component.html
- movement-column-renderer.component.ts
- accounts-detail.component.css
- accounts-detail.component.html
- accounts-detail.component.ts
- movement-column-renderer
- accounts-home
- account-number-render
- account-number-render.component.css
- account-number-render.component.html
- account-number-render.component.ts
- accounts-home.component.css
- accounts-home.component.html
- accounts-home.component.ts
- account-number-render
- accounts-new
- accounts-new.component.css
- accounts-new.component.html
- accounts-new.component.ts
- add-customer
- add-customer.component.css
- add-customer.component.html
- add-customer.component.ts
- add-movement
- add-movement.component.css
- add-movement.component.html
- add-movement.component.ts
- accounts-routing.module.ts
- accounts.module.ts
- accounts-detail
- branches
- branches-detail
- branches-detail.component.css
- branches-detail.component.html
- branches-detail.component.ts
- branches-home
- branches-home.component.css
- branches-home.component.html
- branches-home.component.ts
- branches-new
- branches-new.component.css
- branches-new.component.html
- branches-new.component.ts
- branches-routing.module.ts
- branches.module.ts
- branches-detail
- customers
- customers-detail
- customers-detail.component.css
- customers-detail.component.html
- customers-detail.component.ts
- customers-home
- customertype-column-renderer
- customertype-column-renderer.component.css
- customertype-column-renderer.component.html
- customertype-column-renderer.component.ts
- customers-home.component.css
- customers-home.component.html
- customers-home.component.ts
- customertype-column-renderer
- customers-new
- customers-new.component.css
- customers-new.component.html
- customers-new.component.ts
- customers-routing.module.ts
- customers.module.ts
- customers-detail
- employees
- employees-detail
- employees-detail.component.css
- employees-detail.component.html
- employees-detail.component.ts
- employees-home
- employees-home.component.css
- employees-home.component.html
- employees-home.component.ts
- employees-routing.module.ts
- employees.module.ts
- employees-detail
- home
- home-routing.module.ts
- home.component.html
- home.component.scss
- home.component.ts
- home.module.ts
- service-ex
- service-ex-details
- service-ex-details.component.css
- service-ex-details.component.html
- service-ex-details.component.ts
- service-ex-home
- service-ex-home.component.css
- service-ex-home.component.html
- service-ex-home.component.ts
- service-ex-routing.module.ts
- service-ex.module.ts
- service-ex-details
- main-routing.module.ts
- main.component.html
- main.component.scss
- main.component.ts
- main.module.ts
- accounts
- shared
- account-card
- account-card.component.css
- account-card.component.html
- account-card.component.ts
- branch-card
- branch-card.component.css
- branch-card.component.html
- branch-card.component.ts
- customer-card
- customer-card.component.css
- customer-card.component.html
- customer-card.component.ts
- employee-card
- employee-card.component.css
- employee-card.component.html
- employee-card.component.ts
- service-ex-card
- service-ex-card.component.css
- service-ex-card.component.html
- service-ex-card.component.ts
- app.menu.config.ts
- app.services.config.ts
- shared.module.ts
- star-wars-response-adapter.ts
- star-wars.service.ts
- account-card
- app-routing.module.ts
- app.component.html
- app.component.scss
- app.component.spec.ts
- app.component.ts
- app.config.ts
- app.module.ts
- login
- assets
- css
- app.scss
- loader.css
- i18n
- en.json
- es.json
- icons
- ontimize128.png
- ontimize16.png
- ontimize256.png
- ontimize32.png
- ontimize48.png
- ontimize64.png
- ontimize72.png
- ontimize96.png
- images
- login_bg.png
- no-image.png
- normal_24.png
- ontimize.png
- ontimize_web_log.png
- other_24.png
- sidenav-closed.png
- sidenav-opened.png
- user_profile.png
- vip_24.png
- js
- domchange.js
- keyboard.js
- .gitkeep
- css
- environments
- environment.prod.ts
- environment.ts
- favicon.ico
- index.html
- main.ts
- manifest.webmanifest
- polyfills.ts
- styles.scss
- test.ts
- app
- .browserslistrc
- .editorconfig
- .eslintrc.json
- .gitignore
- angular.json
- karma.conf.js
- ngsw-config.json
- package-lock.json
- package.json
- README.md
- tsconfig.app.json
- tsconfig.json
- tsconfig.spec.json
- e2e
Añadir el módulo de gráficas al módulo de cuentas
accounts.module.ts
import { NgModule } from '@angular/core';
import { CommonModule } from '@angular/common';
import { OntimizeWebModule } from 'ontimize-web-ngx';
import { AccountsRoutingModule } from './accounts-routing.module';
import { AccountsHomeComponent } from './accounts-home/accounts-home.component';
import { SharedModule } from 'src/app/shared/shared.module';
import { AccountsDetailComponent } from './accounts-detail/accounts-detail.component';
import { AccountsNewComponent } from './accounts-new/accounts-new.component';
import { AddCustomerComponent } from './add-customer/add-customer.component';
import { AddMovementComponent } from './add-movement/add-movement.component';
import { OChartModule } from 'ontimize-web-ngx-charts';


@NgModule({
  declarations: [
    AccountsHomeComponent,
    AccountsDetailComponent,
    AccountsNewComponent,
    AddCustomerComponent,
    AddMovementComponent
  ],
  imports: [
    CommonModule,
    SharedModule,
    OntimizeWebModule,
    AccountsRoutingModule,
    OChartModule
  ]
})
export class AccountsModule { }- ontimize-web-tutorial
- e2e
- src
- app.e2e-spec.ts
- app.po.ts
- protractor.conf.js
- tsconfig.json
- src
- src
- app
- login
- login-routing.module.ts
- login.component.html
- login.component.scss
- login.component.ts
- login.module.ts
- login.theme.scss
- main
- accounts
- accounts-detail
- movement-column-renderer
- movement-column-renderer.component.css
- movement-column-renderer.component.html
- movement-column-renderer.component.ts
- accounts-detail.component.css
- accounts-detail.component.html
- accounts-detail.component.ts
- movement-column-renderer
- accounts-home
- account-number-render
- account-number-render.component.css
- account-number-render.component.html
- account-number-render.component.ts
- accounts-home.component.css
- accounts-home.component.html
- accounts-home.component.ts
- account-number-render
- accounts-new
- accounts-new.component.css
- accounts-new.component.html
- accounts-new.component.ts
- add-customer
- add-customer.component.css
- add-customer.component.html
- add-customer.component.ts
- add-movement
- add-movement.component.css
- add-movement.component.html
- add-movement.component.ts
- accounts-routing.module.ts
- accounts.module.ts
- accounts-detail
- branches
- branches-detail
- branches-detail.component.css
- branches-detail.component.html
- branches-detail.component.ts
- branches-home
- branches-home.component.css
- branches-home.component.html
- branches-home.component.ts
- branches-new
- branches-new.component.css
- branches-new.component.html
- branches-new.component.ts
- branches-routing.module.ts
- branches.module.ts
- branches-detail
- customers
- customers-detail
- customers-detail.component.css
- customers-detail.component.html
- customers-detail.component.ts
- customers-home
- customertype-column-renderer
- customertype-column-renderer.component.css
- customertype-column-renderer.component.html
- customertype-column-renderer.component.ts
- customers-home.component.css
- customers-home.component.html
- customers-home.component.ts
- customertype-column-renderer
- customers-new
- customers-new.component.css
- customers-new.component.html
- customers-new.component.ts
- customers-routing.module.ts
- customers.module.ts
- customers-detail
- employees
- employees-detail
- employees-detail.component.css
- employees-detail.component.html
- employees-detail.component.ts
- employees-home
- employees-home.component.css
- employees-home.component.html
- employees-home.component.ts
- employees-routing.module.ts
- employees.module.ts
- employees-detail
- home
- home-routing.module.ts
- home.component.html
- home.component.scss
- home.component.ts
- home.module.ts
- service-ex
- service-ex-details
- service-ex-details.component.css
- service-ex-details.component.html
- service-ex-details.component.ts
- service-ex-home
- service-ex-home.component.css
- service-ex-home.component.html
- service-ex-home.component.ts
- service-ex-routing.module.ts
- service-ex.module.ts
- service-ex-details
- main-routing.module.ts
- main.component.html
- main.component.scss
- main.component.ts
- main.module.ts
- accounts
- shared
- account-card
- account-card.component.css
- account-card.component.html
- account-card.component.ts
- branch-card
- branch-card.component.css
- branch-card.component.html
- branch-card.component.ts
- customer-card
- customer-card.component.css
- customer-card.component.html
- customer-card.component.ts
- employee-card
- employee-card.component.css
- employee-card.component.html
- employee-card.component.ts
- service-ex-card
- service-ex-card.component.css
- service-ex-card.component.html
- service-ex-card.component.ts
- app.menu.config.ts
- app.services.config.ts
- shared.module.ts
- star-wars-response-adapter.ts
- star-wars.service.ts
- account-card
- app-routing.module.ts
- app.component.html
- app.component.scss
- app.component.spec.ts
- app.component.ts
- app.config.ts
- app.module.ts
- login
- assets
- css
- app.scss
- loader.css
- i18n
- en.json
- es.json
- icons
- ontimize128.png
- ontimize16.png
- ontimize256.png
- ontimize32.png
- ontimize48.png
- ontimize64.png
- ontimize72.png
- ontimize96.png
- images
- login_bg.png
- no-image.png
- normal_24.png
- ontimize.png
- ontimize_web_log.png
- other_24.png
- sidenav-closed.png
- sidenav-opened.png
- user_profile.png
- vip_24.png
- js
- domchange.js
- keyboard.js
- .gitkeep
- css
- environments
- environment.prod.ts
- environment.ts
- favicon.ico
- index.html
- main.ts
- manifest.webmanifest
- polyfills.ts
- styles.scss
- test.ts
- app
- .browserslistrc
- .editorconfig
- .eslintrc.json
- .gitignore
- angular.json
- karma.conf.js
- ngsw-config.json
- package-lock.json
- package.json
- README.md
- tsconfig.app.json
- tsconfig.json
- tsconfig.spec.json
- e2e
Actualizar componente detalle de cuentas
En el componente detalle, se definen tanto parametros de configuracion de una gráfica tipo tarta como la consulta al servicio de localización
accounts-detail.component.ts
import { Component } from '@angular/core';
import { OTranslateService } from 'ontimize-web-ngx';
import { PieChartConfiguration } from 'ontimize-web-ngx-charts';

@Component({
  selector: 'app-accounts-detail',
  templateUrl: './accounts-detail.component.html',
  styleUrls: ['./accounts-detail.component.css']
})
export class AccountsDetailComponent {

  public movementTypesChartParams: PieChartConfiguration;

  constructor(private translateService: OTranslateService) {
    this._configurePieChart();
  }

  private _configurePieChart(): void {
    this.movementTypesChartParams = new PieChartConfiguration();
    this.movementTypesChartParams.margin.top = 0;
    this.movementTypesChartParams.margin.right = 0;
    this.movementTypesChartParams.margin.bottom = 0;
    this.movementTypesChartParams.margin.left = 0;
    this.movementTypesChartParams.legendPosition = "right";
  }

}
Para usar la configuración del gráfico de tarta que se crea en el fichero accounts-detail.component.ts lo pasaremos como parámetro en la gráfica [chart-parameters]="movementTypesChartParams"
accounts-detail.component.html
<o-form attr="accountsTable" editable-detail=" false" service="branches" entity="accountBalance" keys="ACCOUNTID"
    columns="ACCOUNTID;ACCOUNTNUMBER" show-header="yes" header-actions="R;D" show-header-navigation="yes"
    keys-sql-types="INTEGER" class="fill-form">
    <div fxLayout="column" fxLayoutGap="8px">
        <div fxLayout="row" fxLayoutGap="8px">
            <o-text-input fxFlex="40" attr="ACCOUNTNUMBER" sql-type="STRING"></o-text-input>
            <o-combo fxFlex="50" attr="OFFICEID" service="branches" entity="branch" keys="OFFICEID"
                columns="OFFICEID;NAME" visible-columns="NAME" value-column="OFFICEID"></o-combo>
            <o-currency-input fxFlex="20" attr="BALANCE" currency-symbol="EUR"
                max-decimal-digits="2"></o-currency-input>
        </div>
        <div fxLayout="row" fxLayoutGap="8px">
            <o-date-input fxFlex="20" attr="ENDDATE"></o-date-input>
            <o-percent-input fxFlex="20" attr="INTERESRATE"></o-percent-input>
            <o-text-input fxFlex="60" attr="ACCOUNTTYP" sql-type="STRING"></o-text-input>
        </div>
        <div fxFlex fxLayout="row" fxLayoutGap="8px">
            <o-table fxFlex="50" attr="customersTable" service="customers" entity="vCustomerAccount"
                parent-keys="ACCOUNTID" keys="CUSTOMERACCOUNTID"
                columns="ID;NAME;SURNAME;CUSTOMERID;CUSTOMERACCOUNTID;CUSTOMERTYPEID"
                visible-columns="ID;NAME;SURNAME;CUSTOMERTYPEID" query-rows="15" insert-button="yes"
                insert-form-route="addcustomer/new" detail-mode="none">
                <o-table-column attr="ID" title="ID" content-align="center"></o-table-column>
                <o-table-column attr="NAME" title="NAME" content-align="center"></o-table-column>
                <o-table-column attr="SURNAME" title="SURNAME"></o-table-column>
                <o-table-column attr="CUSTOMERTYPEID" title="CUSTOMERTYPEID" content-align="center">
                    <app-customertype-column-renderer></app-customertype-column-renderer>
                </o-table-column>
            </o-table>
            <o-table fxFlex="50" attr="movementsTable" service="movements" entity="movement" parent-keys="ACCOUNTID"
                keys="MOVEMENTID" columns="DATE_;CONCEPT;MOVEMENT;MOVEMENTTYPEID"
                visible-columns="DATE_;CONCEPT;MOVEMENT;MOVEMENTTYPEID" query-rows="15"
                insert-form-route="addMovement/new" detail-mode="none" insert-button="yes">
                <o-table-column attr="DATE_" title="DATE_" type="date" format="LL"></o-table-column>
                <o-table-column attr="MOVEMENT" title="MOVEMENT" content-align="center">
                    <app-movement-column-renderer></app-movement-column-renderer>
                </o-table-column>
                <o-table-column attr="MOVEMENTTYPEID" title="MOVEMENTTYPEID">
                    <o-table-cell-renderer-service service="movements" entity="movementType"
                        columns="DESCRIPTION;MOVEMENTTYPEID" value-column="DESCRIPTION">
                    </o-table-cell-renderer-service>
                </o-table-column>
            </o-table>
        </div>
        <div fxFlex fxLayout="row" class="bg-level-1" fxLayoutAlign="center center">
            <o-chart type="pie" service="movements" entity="movement" x-axis="CONCEPT" parent-keys="ACCOUNTID"
                query-on-init="no" y-axis="MOVEMENT" [chart-parameters]="movementTypesChartParams"></o-chart>
        </div>
    </div>
</o-form>- ontimize-web-tutorial
- e2e
- src
- app.e2e-spec.ts
- app.po.ts
- protractor.conf.js
- tsconfig.json
- src
- src
- app
- login
- login-routing.module.ts
- login.component.html
- login.component.scss
- login.component.ts
- login.module.ts
- login.theme.scss
- main
- accounts
- accounts-detail
- movement-column-renderer
- movement-column-renderer.component.css
- movement-column-renderer.component.html
- movement-column-renderer.component.ts
- accounts-detail.component.css
- accounts-detail.component.html
- accounts-detail.component.ts
- movement-column-renderer
- accounts-home
- account-number-render
- account-number-render.component.css
- account-number-render.component.html
- account-number-render.component.ts
- accounts-home.component.css
- accounts-home.component.html
- accounts-home.component.ts
- account-number-render
- accounts-new
- accounts-new.component.css
- accounts-new.component.html
- accounts-new.component.ts
- add-customer
- add-customer.component.css
- add-customer.component.html
- add-customer.component.ts
- add-movement
- add-movement.component.css
- add-movement.component.html
- add-movement.component.ts
- accounts-routing.module.ts
- accounts.module.ts
- accounts-detail
- branches
- branches-detail
- branches-detail.component.css
- branches-detail.component.html
- branches-detail.component.ts
- branches-home
- branches-home.component.css
- branches-home.component.html
- branches-home.component.ts
- branches-new
- branches-new.component.css
- branches-new.component.html
- branches-new.component.ts
- branches-routing.module.ts
- branches.module.ts
- branches-detail
- customers
- customers-detail
- customers-detail.component.css
- customers-detail.component.html
- customers-detail.component.ts
- customers-home
- customertype-column-renderer
- customertype-column-renderer.component.css
- customertype-column-renderer.component.html
- customertype-column-renderer.component.ts
- customers-home.component.css
- customers-home.component.html
- customers-home.component.ts
- customertype-column-renderer
- customers-new
- customers-new.component.css
- customers-new.component.html
- customers-new.component.ts
- customers-routing.module.ts
- customers.module.ts
- customers-detail
- employees
- employees-detail
- employees-detail.component.css
- employees-detail.component.html
- employees-detail.component.ts
- employees-home
- employees-home.component.css
- employees-home.component.html
- employees-home.component.ts
- employees-routing.module.ts
- employees.module.ts
- employees-detail
- home
- home-routing.module.ts
- home.component.html
- home.component.scss
- home.component.ts
- home.module.ts
- service-ex
- service-ex-details
- service-ex-details.component.css
- service-ex-details.component.html
- service-ex-details.component.ts
- service-ex-home
- service-ex-home.component.css
- service-ex-home.component.html
- service-ex-home.component.ts
- service-ex-routing.module.ts
- service-ex.module.ts
- service-ex-details
- main-routing.module.ts
- main.component.html
- main.component.scss
- main.component.ts
- main.module.ts
- accounts
- shared
- account-card
- account-card.component.css
- account-card.component.html
- account-card.component.ts
- branch-card
- branch-card.component.css
- branch-card.component.html
- branch-card.component.ts
- customer-card
- customer-card.component.css
- customer-card.component.html
- customer-card.component.ts
- employee-card
- employee-card.component.css
- employee-card.component.html
- employee-card.component.ts
- service-ex-card
- service-ex-card.component.css
- service-ex-card.component.html
- service-ex-card.component.ts
- app.menu.config.ts
- app.services.config.ts
- shared.module.ts
- star-wars-response-adapter.ts
- star-wars.service.ts
- account-card
- app-routing.module.ts
- app.component.html
- app.component.scss
- app.component.spec.ts
- app.component.ts
- app.config.ts
- app.module.ts
- login
- assets
- css
- app.scss
- loader.css
- i18n
- en.json
- es.json
- icons
- ontimize128.png
- ontimize16.png
- ontimize256.png
- ontimize32.png
- ontimize48.png
- ontimize64.png
- ontimize72.png
- ontimize96.png
- images
- login_bg.png
- no-image.png
- normal_24.png
- ontimize.png
- ontimize_web_log.png
- other_24.png
- sidenav-closed.png
- sidenav-opened.png
- user_profile.png
- vip_24.png
- js
- domchange.js
- keyboard.js
- .gitkeep
- css
- environments
- environment.prod.ts
- environment.ts
- favicon.ico
- index.html
- main.ts
- manifest.webmanifest
- polyfills.ts
- styles.scss
- test.ts
- app
- .browserslistrc
- .editorconfig
- .eslintrc.json
- .gitignore
- angular.json
- karma.conf.js
- ngsw-config.json
- package-lock.json
- package.json
- README.md
- tsconfig.app.json
- tsconfig.json
- tsconfig.spec.json
- e2e
Traducciones
en.json
{
  ...
  "OVER": "Over",
  "UNDER": "Under",
  "CRITERIA_VALUE": "Criteria"
}
es.json
{
  ...
  "OVER": "Por encima",
  "UNDER": "Por debajo",
  "CRITERIA_VALUE": "Criterio"
}- ontimize-web-tutorial
- e2e
- src
- app.e2e-spec.ts
- app.po.ts
- protractor.conf.js
- tsconfig.json
- src
- src
- app
- login
- login-routing.module.ts
- login.component.html
- login.component.scss
- login.component.ts
- login.module.ts
- login.theme.scss
- main
- accounts
- accounts-detail
- movement-column-renderer
- movement-column-renderer.component.css
- movement-column-renderer.component.html
- movement-column-renderer.component.ts
- accounts-detail.component.css
- accounts-detail.component.html
- accounts-detail.component.ts
- movement-column-renderer
- accounts-home
- account-number-render
- account-number-render.component.css
- account-number-render.component.html
- account-number-render.component.ts
- accounts-home.component.css
- accounts-home.component.html
- accounts-home.component.ts
- account-number-render
- accounts-new
- accounts-new.component.css
- accounts-new.component.html
- accounts-new.component.ts
- add-customer
- add-customer.component.css
- add-customer.component.html
- add-customer.component.ts
- add-movement
- add-movement.component.css
- add-movement.component.html
- add-movement.component.ts
- accounts-routing.module.ts
- accounts.module.ts
- accounts-detail
- branches
- branches-detail
- branches-detail.component.css
- branches-detail.component.html
- branches-detail.component.ts
- branches-home
- branches-home.component.css
- branches-home.component.html
- branches-home.component.ts
- branches-new
- branches-new.component.css
- branches-new.component.html
- branches-new.component.ts
- branches-routing.module.ts
- branches.module.ts
- branches-detail
- customers
- customers-detail
- customers-detail.component.css
- customers-detail.component.html
- customers-detail.component.ts
- customers-home
- customertype-column-renderer
- customertype-column-renderer.component.css
- customertype-column-renderer.component.html
- customertype-column-renderer.component.ts
- customers-home.component.css
- customers-home.component.html
- customers-home.component.ts
- customertype-column-renderer
- customers-new
- customers-new.component.css
- customers-new.component.html
- customers-new.component.ts
- customers-routing.module.ts
- customers.module.ts
- customers-detail
- employees
- employees-detail
- employees-detail.component.css
- employees-detail.component.html
- employees-detail.component.ts
- employees-home
- employees-home.component.css
- employees-home.component.html
- employees-home.component.ts
- employees-routing.module.ts
- employees.module.ts
- employees-detail
- home
- home-routing.module.ts
- home.component.html
- home.component.scss
- home.component.ts
- home.module.ts
- service-ex
- service-ex-details
- service-ex-details.component.css
- service-ex-details.component.html
- service-ex-details.component.ts
- service-ex-home
- service-ex-home.component.css
- service-ex-home.component.html
- service-ex-home.component.ts
- service-ex-routing.module.ts
- service-ex.module.ts
- service-ex-details
- main-routing.module.ts
- main.component.html
- main.component.scss
- main.component.ts
- main.module.ts
- accounts
- shared
- account-card
- account-card.component.css
- account-card.component.html
- account-card.component.ts
- branch-card
- branch-card.component.css
- branch-card.component.html
- branch-card.component.ts
- customer-card
- customer-card.component.css
- customer-card.component.html
- customer-card.component.ts
- employee-card
- employee-card.component.css
- employee-card.component.html
- employee-card.component.ts
- service-ex-card
- service-ex-card.component.css
- service-ex-card.component.html
- service-ex-card.component.ts
- app.menu.config.ts
- app.services.config.ts
- shared.module.ts
- star-wars-response-adapter.ts
- star-wars.service.ts
- account-card
- app-routing.module.ts
- app.component.html
- app.component.scss
- app.component.spec.ts
- app.component.ts
- app.config.ts
- app.module.ts
- login
- assets
- css
- app.scss
- loader.css
- i18n
- en.json
- es.json
- icons
- ontimize128.png
- ontimize16.png
- ontimize256.png
- ontimize32.png
- ontimize48.png
- ontimize64.png
- ontimize72.png
- ontimize96.png
- images
- login_bg.png
- no-image.png
- normal_24.png
- ontimize.png
- ontimize_web_log.png
- other_24.png
- sidenav-closed.png
- sidenav-opened.png
- user_profile.png
- vip_24.png
- js
- domchange.js
- keyboard.js
- .gitkeep
- css
- environments
- environment.prod.ts
- environment.ts
- favicon.ico
- index.html
- main.ts
- manifest.webmanifest
- polyfills.ts
- styles.scss
- test.ts
- app
- .browserslistrc
- .editorconfig
- .eslintrc.json
- .gitignore
- angular.json
- karma.conf.js
- ngsw-config.json
- package-lock.json
- package.json
- README.md
- tsconfig.app.json
- tsconfig.json
- tsconfig.spec.json
- e2e
Usar el componente de las gráficas en tarjetas
Para usar el componente de las gráficas en tarjetas, es importante que el módulo que lo importe sea shared, para que pueda ser usado tanto por el componente de la tarjeta como por el componente de accounts-detail
Eliminamos las referencias el módulo de gráficas del módulo accounts-module
accounts.module.ts
import { NgModule } from '@angular/core';
import { CommonModule } from '@angular/common';
import { OntimizeWebModule } from 'ontimize-web-ngx';
import { AccountsRoutingModule } from './accounts-routing.module';
import { AccountsHomeComponent } from './accounts-home/accounts-home.component';
import { SharedModule } from 'src/app/shared/shared.module';
import { AccountsDetailComponent } from './accounts-detail/accounts-detail.component';
import { AccountsNewComponent } from './accounts-new/accounts-new.component';
import { AddCustomerComponent } from './add-customer/add-customer.component';
import { AddMovementComponent } from './add-movement/add-movement.component';


@NgModule({
  declarations: [
    AccountsHomeComponent,
    AccountsDetailComponent,
    AccountsNewComponent,
    AddCustomerComponent,
    AddMovementComponent
  ],
  imports: [
    CommonModule,
    SharedModule,
    OntimizeWebModule,
    AccountsRoutingModule
  ]
})
export class AccountsModule { }
Y las añadimos al módulo de shared
shared.module.ts
import { CommonModule } from '@angular/common';
import { NgModule } from '@angular/core';
import { OntimizeWebModule } from 'ontimize-web-ngx';
import { AccountNumberRenderComponent } from '../main/accounts/accounts-home/account-number-render/account-number-render.component';
import { CustomertypeColumnRendererComponent } from '../main/customers/customers-home/customertype-column-renderer/customertype-column-renderer.component';
import { MovementColumnRendererComponent } from '../main/accounts/accounts-detail/movement-column-renderer/movement-column-renderer.component';
import { MENU_COMPONENTS } from './app.menu.config';
import { OChartModule } from 'ontimize-web-ngx-charts';

export function intRateMonthlyFunction(rowData: Array<any>): number {
  return rowData["INTERESRATE"] / 12;
}

@NgModule({
  imports: [
    OntimizeWebModule,
    OChartModule
  ],
  declarations: [
    AccountNumberRenderComponent,
    CustomertypeColumnRendererComponent,
    MovementColumnRendererComponent,
    ...MENU_COMPONENTS
  ],
  exports: [
    CommonModule,
    AccountNumberRenderComponent,
    CustomertypeColumnRendererComponent,
    MovementColumnRendererComponent,
    ...MENU_COMPONENTS,
    OChartModule
  ]
})
export class SharedModule { }- ontimize-web-tutorial
- e2e
- src
- app.e2e-spec.ts
- app.po.ts
- protractor.conf.js
- tsconfig.json
- src
- src
- app
- login
- login-routing.module.ts
- login.component.html
- login.component.scss
- login.component.ts
- login.module.ts
- login.theme.scss
- main
- accounts
- accounts-detail
- movement-column-renderer
- movement-column-renderer.component.css
- movement-column-renderer.component.html
- movement-column-renderer.component.ts
- accounts-detail.component.css
- accounts-detail.component.html
- accounts-detail.component.ts
- movement-column-renderer
- accounts-home
- account-number-render
- account-number-render.component.css
- account-number-render.component.html
- account-number-render.component.ts
- accounts-home.component.css
- accounts-home.component.html
- accounts-home.component.ts
- account-number-render
- accounts-new
- accounts-new.component.css
- accounts-new.component.html
- accounts-new.component.ts
- add-customer
- add-customer.component.css
- add-customer.component.html
- add-customer.component.ts
- add-movement
- add-movement.component.css
- add-movement.component.html
- add-movement.component.ts
- accounts-routing.module.ts
- accounts.module.ts
- accounts-detail
- branches
- branches-detail
- branches-detail.component.css
- branches-detail.component.html
- branches-detail.component.ts
- branches-home
- branches-home.component.css
- branches-home.component.html
- branches-home.component.ts
- branches-new
- branches-new.component.css
- branches-new.component.html
- branches-new.component.ts
- branches-routing.module.ts
- branches.module.ts
- branches-detail
- customers
- customers-detail
- customers-detail.component.css
- customers-detail.component.html
- customers-detail.component.ts
- customers-home
- customertype-column-renderer
- customertype-column-renderer.component.css
- customertype-column-renderer.component.html
- customertype-column-renderer.component.ts
- customers-home.component.css
- customers-home.component.html
- customers-home.component.ts
- customertype-column-renderer
- customers-new
- customers-new.component.css
- customers-new.component.html
- customers-new.component.ts
- customers-routing.module.ts
- customers.module.ts
- customers-detail
- employees
- employees-detail
- employees-detail.component.css
- employees-detail.component.html
- employees-detail.component.ts
- employees-home
- employees-home.component.css
- employees-home.component.html
- employees-home.component.ts
- employees-routing.module.ts
- employees.module.ts
- employees-detail
- home
- home-routing.module.ts
- home.component.html
- home.component.scss
- home.component.ts
- home.module.ts
- service-ex
- service-ex-details
- service-ex-details.component.css
- service-ex-details.component.html
- service-ex-details.component.ts
- service-ex-home
- service-ex-home.component.css
- service-ex-home.component.html
- service-ex-home.component.ts
- service-ex-routing.module.ts
- service-ex.module.ts
- service-ex-details
- main-routing.module.ts
- main.component.html
- main.component.scss
- main.component.ts
- main.module.ts
- accounts
- shared
- account-card
- account-card.component.css
- account-card.component.html
- account-card.component.ts
- branch-card
- branch-card.component.css
- branch-card.component.html
- branch-card.component.ts
- customer-card
- customer-card.component.css
- customer-card.component.html
- customer-card.component.ts
- employee-card
- employee-card.component.css
- employee-card.component.html
- employee-card.component.ts
- service-ex-card
- service-ex-card.component.css
- service-ex-card.component.html
- service-ex-card.component.ts
- app.menu.config.ts
- app.services.config.ts
- shared.module.ts
- star-wars-response-adapter.ts
- star-wars.service.ts
- account-card
- app-routing.module.ts
- app.component.html
- app.component.scss
- app.component.spec.ts
- app.component.ts
- app.config.ts
- app.module.ts
- login
- assets
- css
- app.scss
- loader.css
- i18n
- en.json
- es.json
- icons
- ontimize128.png
- ontimize16.png
- ontimize256.png
- ontimize32.png
- ontimize48.png
- ontimize64.png
- ontimize72.png
- ontimize96.png
- images
- login_bg.png
- no-image.png
- normal_24.png
- ontimize.png
- ontimize_web_log.png
- other_24.png
- sidenav-closed.png
- sidenav-opened.png
- user_profile.png
- vip_24.png
- js
- domchange.js
- keyboard.js
- .gitkeep
- css
- environments
- environment.prod.ts
- environment.ts
- favicon.ico
- index.html
- main.ts
- manifest.webmanifest
- polyfills.ts
- styles.scss
- test.ts
- app
- .browserslistrc
- .editorconfig
- .eslintrc.json
- .gitignore
- angular.json
- karma.conf.js
- ngsw-config.json
- package-lock.json
- package.json
- README.md
- tsconfig.app.json
- tsconfig.json
- tsconfig.spec.json
- e2e
Mostrar gráfica en la tarjeta de cuentas
Para la tarjeta de cuentas, queremos mostrar el número de cuentas que tengan más de 5000€
Añadiremos la consulta del balance total de la cuenta y procesaremos los valores para adaptarlos a la gráfica
account-card.component.ts
import { ChangeDetectorRef, Component, OnInit, ViewEncapsulation } from '@angular/core';
import { OntimizeService } from 'ontimize-web-ngx';
import { DonutChartConfiguration } from 'ontimize-web-ngx-charts';
import { Subscription } from 'rxjs';
import { OTranslateService } from "ontimize-web-ngx";


@Component({
  selector: 'app-account-card',
  templateUrl: './account-card.component.html',
  styleUrls: ['./account-card.component.css'],
  encapsulation: ViewEncapsulation.None,
  host: {
    '[class.home-card]': 'true',
    '[class.account-card]': 'true',
  }
})
export class AccountCardComponent implements OnInit {

  accountAmount: any;
  public chartParameters: DonutChartConfiguration;
  protected resData: Array<Object>;
  protected graphData: Array<Object>;
  protected criteriaValue = 5000;
  private subscription: Subscription;
  private translateServiceSubscription: Subscription;

  constructor(
    private ontimizeService: OntimizeService,
    private cd: ChangeDetectorRef,
    private translate: OTranslateService
  ) {
    this.chartParameters = new DonutChartConfiguration();
    this.chartParameters.showLeyend = false;
    this.chartParameters.margin.top = 0;
    this.chartParameters.margin.right = 0;
    this.chartParameters.margin.bottom = 0;
    this.chartParameters.margin.left = 0;
    this.chartParameters.labelType = 'value';
    this.chartParameters.labelSunbeamLayout = false;
    this.chartParameters.valueType = 'intGrouped';

    this.ontimizeService.configureService(this.ontimizeService.getDefaultServiceConfiguration('branches'));
    this.subscription = this.ontimizeService.query(void 0, ['ACCOUNTID', 'BALANCE'], 'accountBalance').subscribe({
      next: (res: any) => {
        if (res && res.data.length && res.code === 0) {
          this.resData = res.data;
          this.accountAmount = res.data.length;
          this.adaptResult(res.data);
        }
      },
      error: (err: any) => console.log(err),
      complete: () => this.cd.detectChanges()
    });

    this.translateServiceSubscription = this.translate.onLanguageChanged.subscribe(() => {
      this.adaptResult(this.resData)
    });
  }

  adaptResult(data: any) {
    if (data && data.length) {
      let values = this.processValues(data);
      // chart data
      this.graphData = values
    }
  }

  processValues(data: any) {
    let values = [];
    let minorValue = 0;
    let majorValue = 0;
    data.forEach((item: any, index: number) => {
      if (item['BALANCE'] >= this.criteriaValue) {
        majorValue++;
      } else {
        minorValue++;
      }
    });

    let lowerCrit = {
      'name': this.translate.get('UNDER'),
      'value': minorValue
    }

    let upperCrit = {
      'name': this.translate.get('OVER'),
      'value': majorValue
    }

    values.push(lowerCrit);
    values.push(upperCrit);
    return values;
  }

  ngOnInit() {
  }

  ngOnDestroy() {
    if (this.subscription) {
      this.subscription.unsubscribe();
      this.translateServiceSubscription.unsubscribe();
    }
  }
}
Añadiremos la gráfica, un título informativo del corte de criterio en la gráfica y los estilos necesarios
account-card.component.html
<div fxLayout="column">
    <div fxLayoutAlign="space-between center" fxLayoutGap="8px">
        <p class="home-card-title" fxFlex>{{ 'TOTAL_ACCOUNT' | oTranslate }}</p>
        <p class="home-card-home-amount" fxFlex>{{ accountAmount }}</p>
    </div>
    <o-chart class="donutChart" type="donutChart" x-label="Axis x" y-label="Axis Y" [data]="graphData"
        [chart-parameters]="chartParameters"></o-chart>
    <div fxLayout="row" fxLayoutAlign="center center">
        <span>{{ 'CRITERIA_VALUE' | oTranslate }}: {{ criteriaValue }} €</span>
    </div>
</div>
account-card.component.css
.account-card {
  height: 100%;
  width: 100%;
  overflow: hidden;
}

.account-card .donutChart {
  margin-top: -140px;
  margin-bottom: -140px;
}- ontimize-web-tutorial
- e2e
- src
- app.e2e-spec.ts
- app.po.ts
- protractor.conf.js
- tsconfig.json
- src
- src
- app
- login
- login-routing.module.ts
- login.component.html
- login.component.scss
- login.component.ts
- login.module.ts
- login.theme.scss
- main
- accounts
- accounts-detail
- movement-column-renderer
- movement-column-renderer.component.css
- movement-column-renderer.component.html
- movement-column-renderer.component.ts
- accounts-detail.component.css
- accounts-detail.component.html
- accounts-detail.component.ts
- movement-column-renderer
- accounts-home
- account-number-render
- account-number-render.component.css
- account-number-render.component.html
- account-number-render.component.ts
- accounts-home.component.css
- accounts-home.component.html
- accounts-home.component.ts
- account-number-render
- accounts-new
- accounts-new.component.css
- accounts-new.component.html
- accounts-new.component.ts
- add-customer
- add-customer.component.css
- add-customer.component.html
- add-customer.component.ts
- add-movement
- add-movement.component.css
- add-movement.component.html
- add-movement.component.ts
- accounts-routing.module.ts
- accounts.module.ts
- accounts-detail
- branches
- branches-detail
- branches-detail.component.css
- branches-detail.component.html
- branches-detail.component.ts
- branches-home
- branches-home.component.css
- branches-home.component.html
- branches-home.component.ts
- branches-new
- branches-new.component.css
- branches-new.component.html
- branches-new.component.ts
- branches-routing.module.ts
- branches.module.ts
- branches-detail
- customers
- customers-detail
- customers-detail.component.css
- customers-detail.component.html
- customers-detail.component.ts
- customers-home
- customertype-column-renderer
- customertype-column-renderer.component.css
- customertype-column-renderer.component.html
- customertype-column-renderer.component.ts
- customers-home.component.css
- customers-home.component.html
- customers-home.component.ts
- customertype-column-renderer
- customers-new
- customers-new.component.css
- customers-new.component.html
- customers-new.component.ts
- customers-routing.module.ts
- customers.module.ts
- customers-detail
- employees
- employees-detail
- employees-detail.component.css
- employees-detail.component.html
- employees-detail.component.ts
- employees-home
- employees-home.component.css
- employees-home.component.html
- employees-home.component.ts
- employees-routing.module.ts
- employees.module.ts
- employees-detail
- home
- home-routing.module.ts
- home.component.html
- home.component.scss
- home.component.ts
- home.module.ts
- service-ex
- service-ex-details
- service-ex-details.component.css
- service-ex-details.component.html
- service-ex-details.component.ts
- service-ex-home
- service-ex-home.component.css
- service-ex-home.component.html
- service-ex-home.component.ts
- service-ex-routing.module.ts
- service-ex.module.ts
- service-ex-details
- main-routing.module.ts
- main.component.html
- main.component.scss
- main.component.ts
- main.module.ts
- accounts
- shared
- account-card
- account-card.component.css
- account-card.component.html
- account-card.component.ts
- branch-card
- branch-card.component.css
- branch-card.component.html
- branch-card.component.ts
- customer-card
- customer-card.component.css
- customer-card.component.html
- customer-card.component.ts
- employee-card
- employee-card.component.css
- employee-card.component.html
- employee-card.component.ts
- service-ex-card
- service-ex-card.component.css
- service-ex-card.component.html
- service-ex-card.component.ts
- app.menu.config.ts
- app.services.config.ts
- shared.module.ts
- star-wars-response-adapter.ts
- star-wars.service.ts
- account-card
- app-routing.module.ts
- app.component.html
- app.component.scss
- app.component.spec.ts
- app.component.ts
- app.config.ts
- app.module.ts
- login
- assets
- css
- app.scss
- loader.css
- i18n
- en.json
- es.json
- icons
- ontimize128.png
- ontimize16.png
- ontimize256.png
- ontimize32.png
- ontimize48.png
- ontimize64.png
- ontimize72.png
- ontimize96.png
- images
- login_bg.png
- no-image.png
- normal_24.png
- ontimize.png
- ontimize_web_log.png
- other_24.png
- sidenav-closed.png
- sidenav-opened.png
- user_profile.png
- vip_24.png
- js
- domchange.js
- keyboard.js
- .gitkeep
- css
- environments
- environment.prod.ts
- environment.ts
- favicon.ico
- index.html
- main.ts
- manifest.webmanifest
- polyfills.ts
- styles.scss
- test.ts
- app
- .browserslistrc
- .editorconfig
- .eslintrc.json
- .gitignore
- angular.json
- karma.conf.js
- ngsw-config.json
- package-lock.json
- package.json
- README.md
- tsconfig.app.json
- tsconfig.json
- tsconfig.spec.json
- e2e