Report on-demand
Introduction
The module Ontimize Web Report on-demand allow the final users of the applications developed with Ontimize to define, view and store reports from any table available in the application.
This visual tool will allow users to define parameters of the report such as:
1.- Title and subtitle
2.- Orientation (vertical or horizontal)
3.- Style (draw grid, row numbers, column names, background on odd rows, hide group details, group in page and first group in page)
4.- Columns to print (allowing to order them and select for each column a title, a width and an alignment)
5.- Order by (allows sorting of report rows)
6.- Groups (allow grouping by columns)
7.- Functions (allows to perform functions on numerical values (maximum, minimum, sum and average) and the total function)
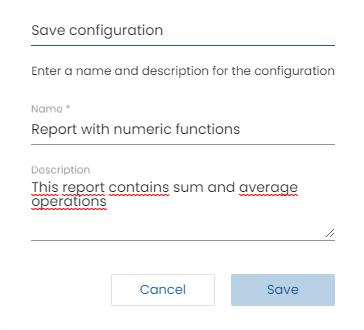
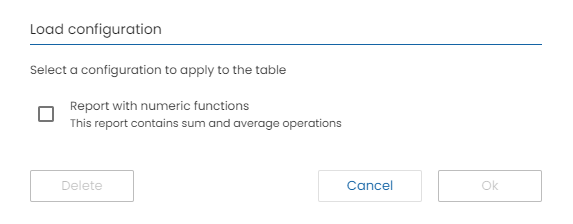
8.- Preferences (allows to save a configuration, apply an existing one or update it)
Report data
The ReportParamsDto class encapsulates parameters for generating a report, with each field holding specific information about the report’s generation and styling.
Main Attributes
- title: A
Stringrepresenting the report title. - entity: A
Stringspecifying the entity for the report. - groups: A
List<String>of groups involved in the report. - orderBy: A
List<OrderByDto>defining data sorting order. - service: A
Stringfor the data fetching service. - path: A
Stringindicating the service path. - vertical: A
Booleanfor the report layout orientation. - functions: A
List<FunctionTypeDto>for applied data functions. - style: An
StyleParamsDtoinstance for style parameters. - subtitle: A
Stringfor the report subtitle. - columns: A
List<ColumnDto>for included columns. - language: A
Stringfor the report language. - filters: A
FilterParameterinstance for data filtering. - advQuery: A
Booleanfor enabling advanced querying.
Nested Classes and Types
OrderByDto
- columnId: Column identifier for sorting.
- ascendent: Boolean for sorting order (ascending/descending).
FunctionTypeDto
- columnName: Target column for the function.
- type: Function type (
SUM,AVERAGE, etc.).
StyleParamsDto
- Boolean flags for style options like
grid,rowNumber,columnName, and others.
ColumnDto
- id: Column identifier.
- name: Column name.
- columnStyle:
ColumnStyleParamsDtoinstance for column styling.
ColumnStyleParamsDto
- width: Column width.
- alignment: Text alignment in the column.
- renderer:
RendererDto(or subclasses) instance for custom data rendering.
Renderers
BooleanRendererDto (extends RendererDto)
- renderType: Type (
stringornumber) for rendering boolean values. - trueValue: Display value for
true. - falseValue: Display value for
false.
DateRendererDto (extends RendererDto)
- format: Date format string.
IntegerRendererDto (extends RendererDto)
- grouping: Boolean for thousand separators usage.
- thousandSeparator: Thousand separator string.
RealRendererDto (extends IntegerRendererDto)
- decimalDigits: Number of decimal digits to display.
This comprehensive structure allows for detailed customization of report generation, from data sourcing and processing to specific styling and formatting.
Below you can see an example of the body of a POST request for the creation of a report.
{
    "title": "Report example",
    "groups": [],
    "entity": "customer",
    "path": "/customers",
    "service": "customers",
    "vertical": true,
    "functions": [],
    "style": {
        "grid": false,
        "rowNumber": false,
        "columnName": true,
        "backgroundOnOddRows": false,
        "hideGroupDetails": false,
        "groupNewPage": false,
        "firstGroupNewPage": false
    },
    "subtitle": "This is a report",
    "columns": [
        {
            "id": "FIRSTLOGIN",
            "name": "FIRSTLOGIN",
            "columnStyle": {
                "renderer": {
                    "type": "boolean",
                    "renderType": "string",
                    "trueValue": "Si",
                    "falseValue": "No"
                }
            }
        },
        {
            "id": "NAME",
            "name": "Nombre"
        },
        {
            "id": "SURNAME",
            "name": "Apellidos"
        },
        {
            "id": "STARTDATE",
            "name": "Fecha inicio",
            "columnStyle": {
                "renderer": {
                    "type": "date",
                    "format": "LL"
                }
            }
        }
    ],
    "orderBy": [{"columnId": "NAME", "ascendent": false}],
    "language": "en",
    "filters": {
        "columns": [
            "FIRSTLOGIN",
            "NAME",
            "SURNAME",
            "STARTDATE",
            "EMAIL",
            "ADDRESS",
            "CUSTOMERTYPEID"
        ],
        "sqltypes": {
            "FIRSTLOGIN": 16,
            "CUSTOMERTYPEID": 1111,
            "SURNAME": 12,
            "CUSTOMERID": 4,
            "STARTDATE": 93,
            "ADDRESS": 12,
            "EMAIL": 12,
            "NAME": 1111,
            "PHOTO": 1111
        },
        "filter": {},
        "offset": 0,
        "pageSize": 4
    },
    "advQuery": true
}
Customizing data provider
- Extend the report service provider and customize the report data configuration that sending REST request.
import { Injectable, Injector } from '@angular/core';
import { OTableComponent } from 'ontimize-web-ngx';
import { IReportDataProvider, OReportPreferences, OntimizeReportDataBaseProvider } from 'ontimize-web-ngx-report';

@Injectable()
export class CustomOntimizeReportDataProvider extends OntimizeReportDataBaseProvider implements IReportDataProvider {

  constructor(injector: Injector) {
    super(injector);
  }

  getReportConfiguration(currentPreference: OReportPreferences, table: OTableComponent) {
    let reportData: any = super.getReportConfiguration(currentPreference, table);

    // Find the index of the column with id "STARTDATE" in the columns array
    const startDateColumnIndex = reportData.columns.findIndex((column: any) => column.id === "STARTDATE");

    // If the column is found, add the renderer object
    if (startDateColumnIndex !== -1) {
      reportData.columns[startDateColumnIndex].columnStyle = {
        ...reportData.columns[startDateColumnIndex].columnStyle,
        "renderer": {
          "type": "date",
          "format": "LL"
        }
      };
    }

    return reportData;
  }

}
- Add the extended service in the previous point in the app.module.ts with the injection token
O_REPORT_DATA_SERVICE.
{ provide: O_REPORT_DATA_SERVICE , useValue:CustomOntimizeReportDataProvider}
NOTE: Remember to complete the steps you need to perform on your backend server to complete the report on-demand configuration following this link
IMPORTANT: In the case of dates, the reports will take the format of the table but the jasperreport library only accepts the formats of the following table.
| Letter | Date or Time Component | Presentation | Examples |
|---|---|---|---|
| G | Era designator | Text | AD |
| y | Year | Year | 1996; 96 |
| M | Month in year | Month | July; Jul; 07 |
| w | Week in year | Number | 27 |
| W | Week in month | Number | 2 |
| D | Day in year | Number | 189 |
| d | Day in month | Number | 10 |
| F | Day of week in month | Number | 2 |
| E | Day in week | Text | Tuesday; Tue |
| a | Am/pm marker | Text | PM |
| H | Hour in day (0-23) | Number | 0 |
| k | Hour in day (1-24) | Number | 24 |
| K | Hour in am/pm (0-11) | Number | 0 |
| h | Hour in am/pm (1-12) | Number | 12 |
| m | Minute in hour | Number | 30 |
| s | Second in minute | Number | 55 |
| S | Millisecond | Number | 978 |
| z | Time zone | General time zone | Pacific Standard Time; PST; GMT-08:00 |
| Z | Time zone | RFC 822 time zone | -0800 |
| Date and Time Pattern | Result |
|---|---|
yyyy.MM.dd G 'at' HH:mm:ss z |
2001.07.04 AD at 12:08:56 PDT |
EEE, MMM d, ''yy |
Wed, Jul 4, ‘01 |
h:mm a |
12:08 PM |
hh 'o''clock' a, zzzz |
12 o’clock PM, Pacific Daylight Time |
K:mm a, z |
0:08 PM, PDT |
yyyyy.MMMMM.dd GGG hh:mm aaa |
02001.July.04 AD 12:08 PM |
EEE, d MMM yyyy HH:mm:ss Z |
Wed, 4 Jul 2001 12:08:56 -0700 |
yyMMddHHmmssZ |
010704120856-0700 |
yyyy-MM-dd'T'HH:mm:ss.SSSZ |
2001-07-04T12:08:56.235-0700 |
Moment formats, accepted in the table, are supported in reports
| Moment.js Format Pattern | Example Result |
|---|---|
LT |
9:43 AM |
LTS |
9:43:18 AM |
L |
02/27/2024 |
l |
2/27/2024 |
LL |
February 27, 2024 |
ll |
Feb 27, 2024 |
LLL |
February 27, 2024 9:43 AM |
lll |
Feb 27, 2024 9:43 AM |
LLLL |
Tuesday, February 27, 2024 9:43 AM |
llll |
Tue, Feb 27, 2024 9:43 AM |
If you need to use ISO formats in the table, you can modify the data that is sent to modify the date format of the reports.
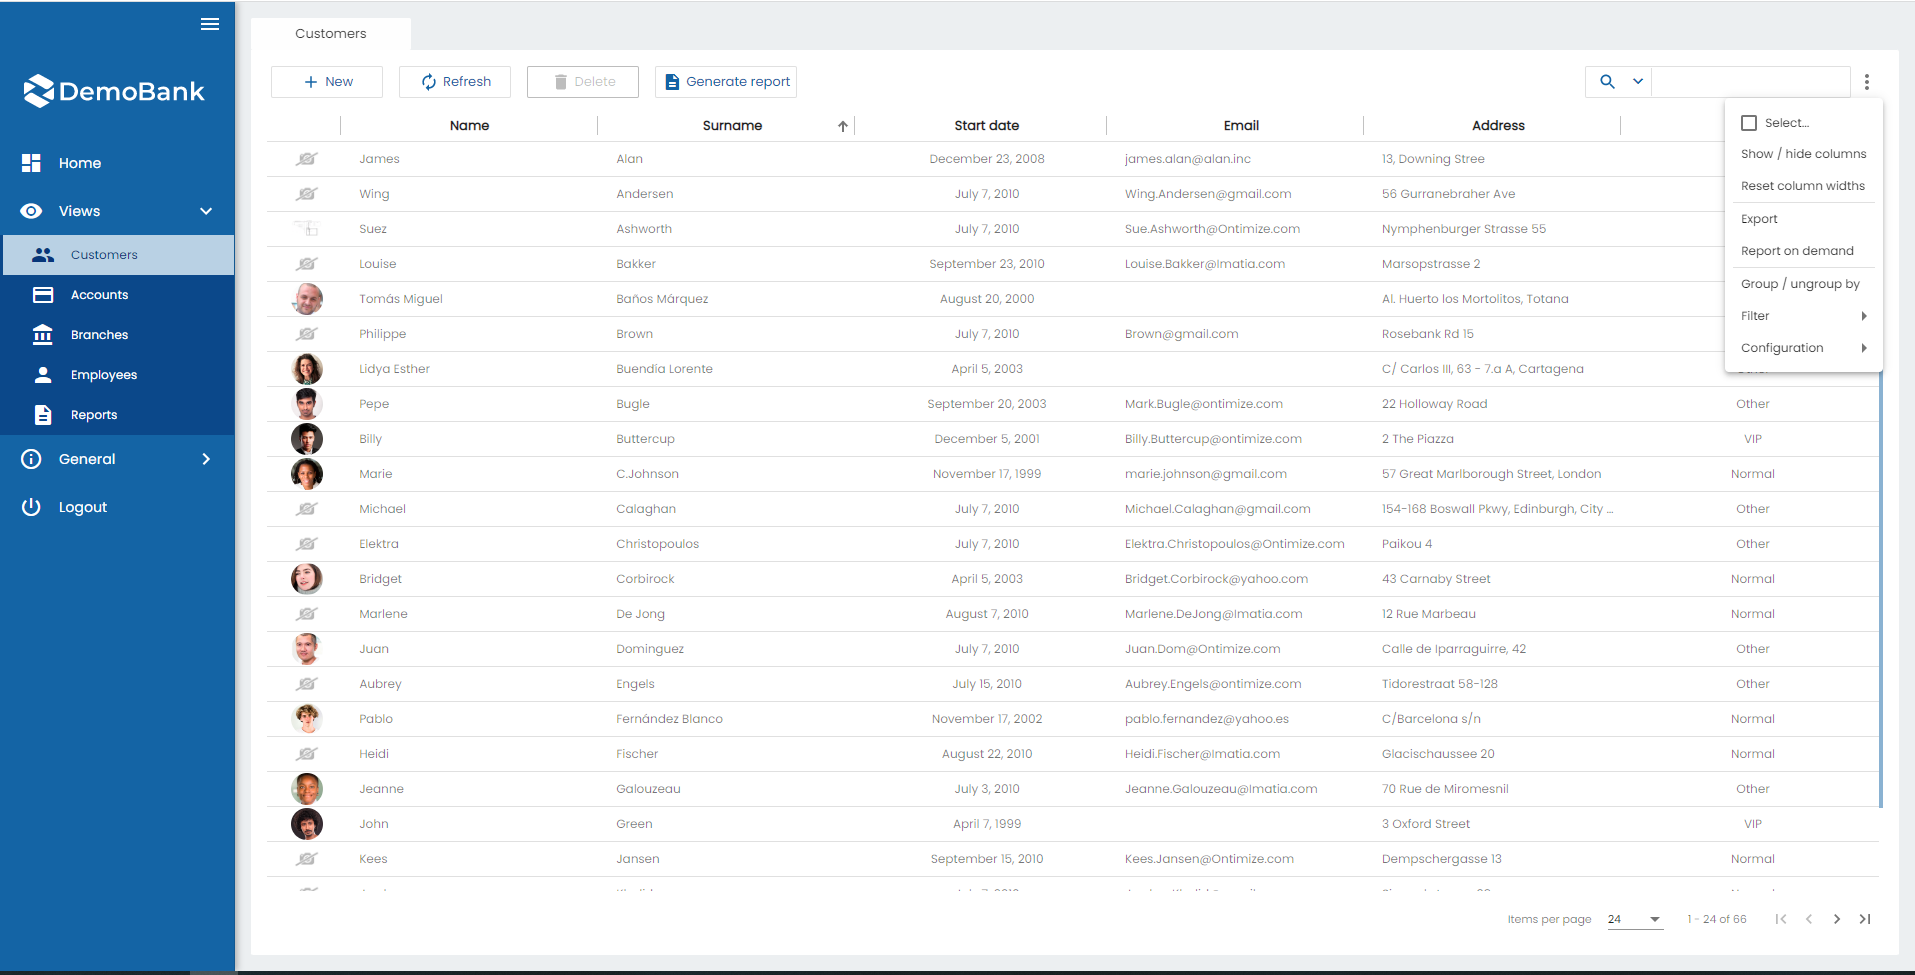
Menu option
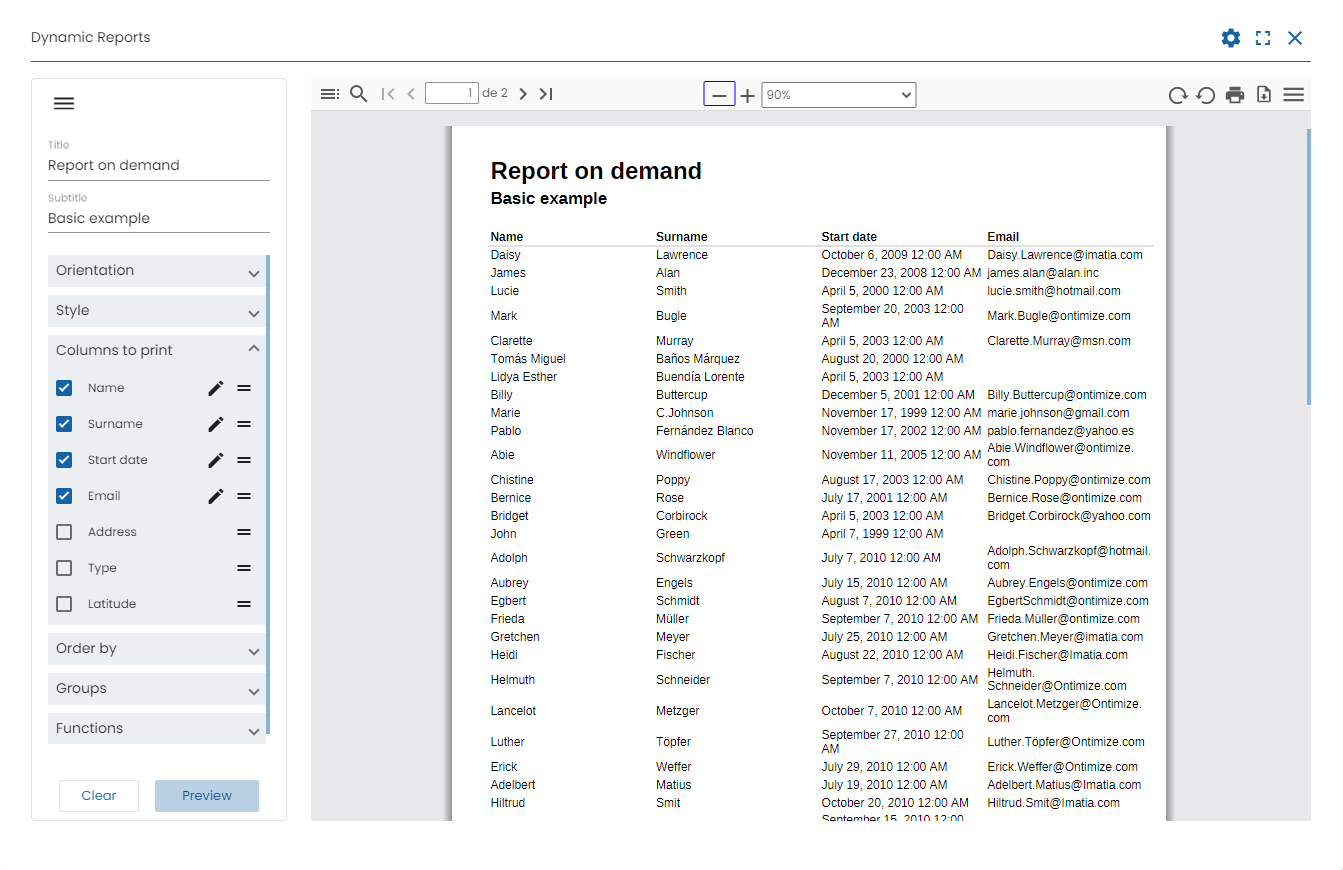
Basic example
This basic example shows a report with four columns, title and subtitle
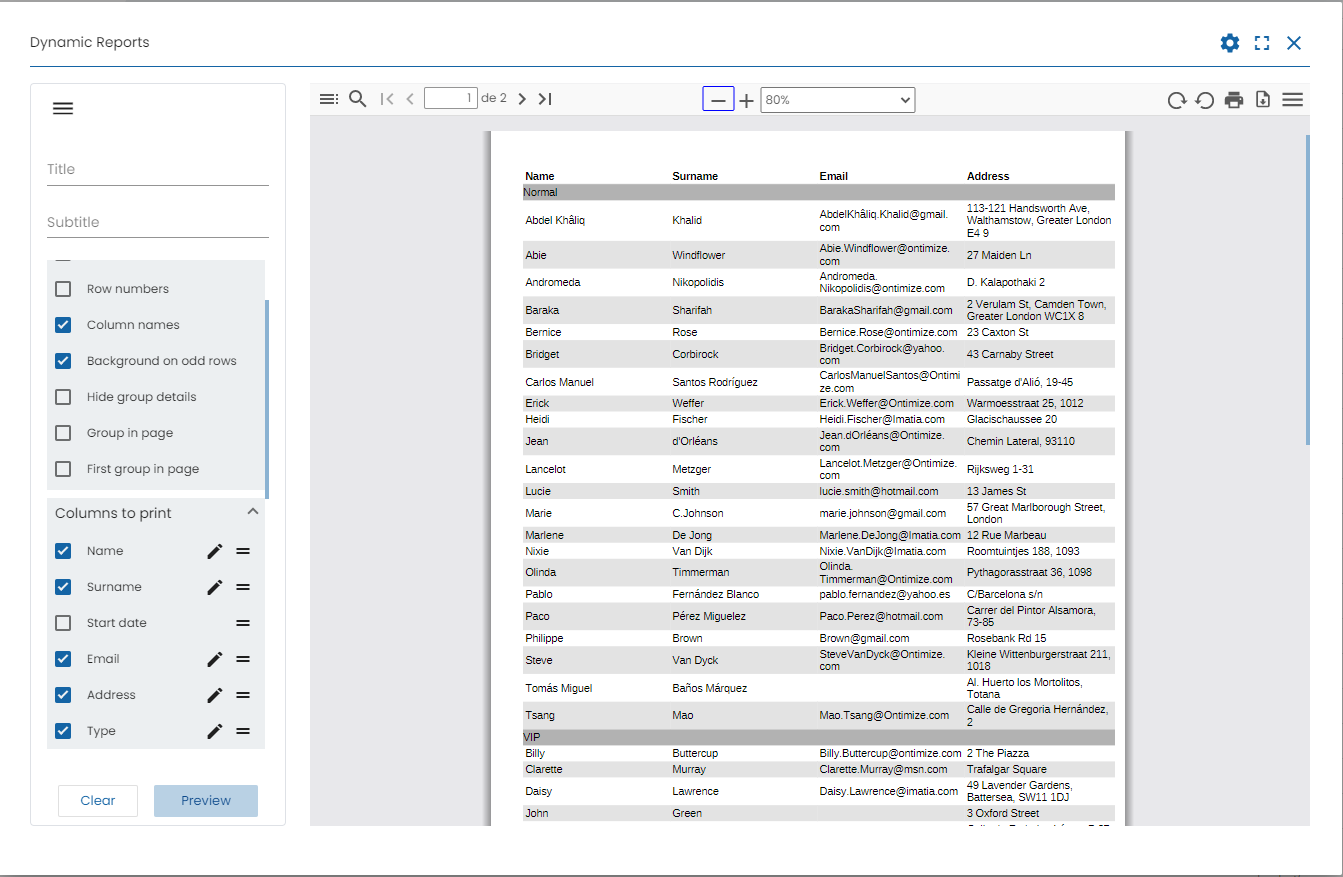
Grouping example
This example shows a report with four columns, grouped by one of them (customer type) and ordered by its name. In addition, a style with a background was added in the odd rows.
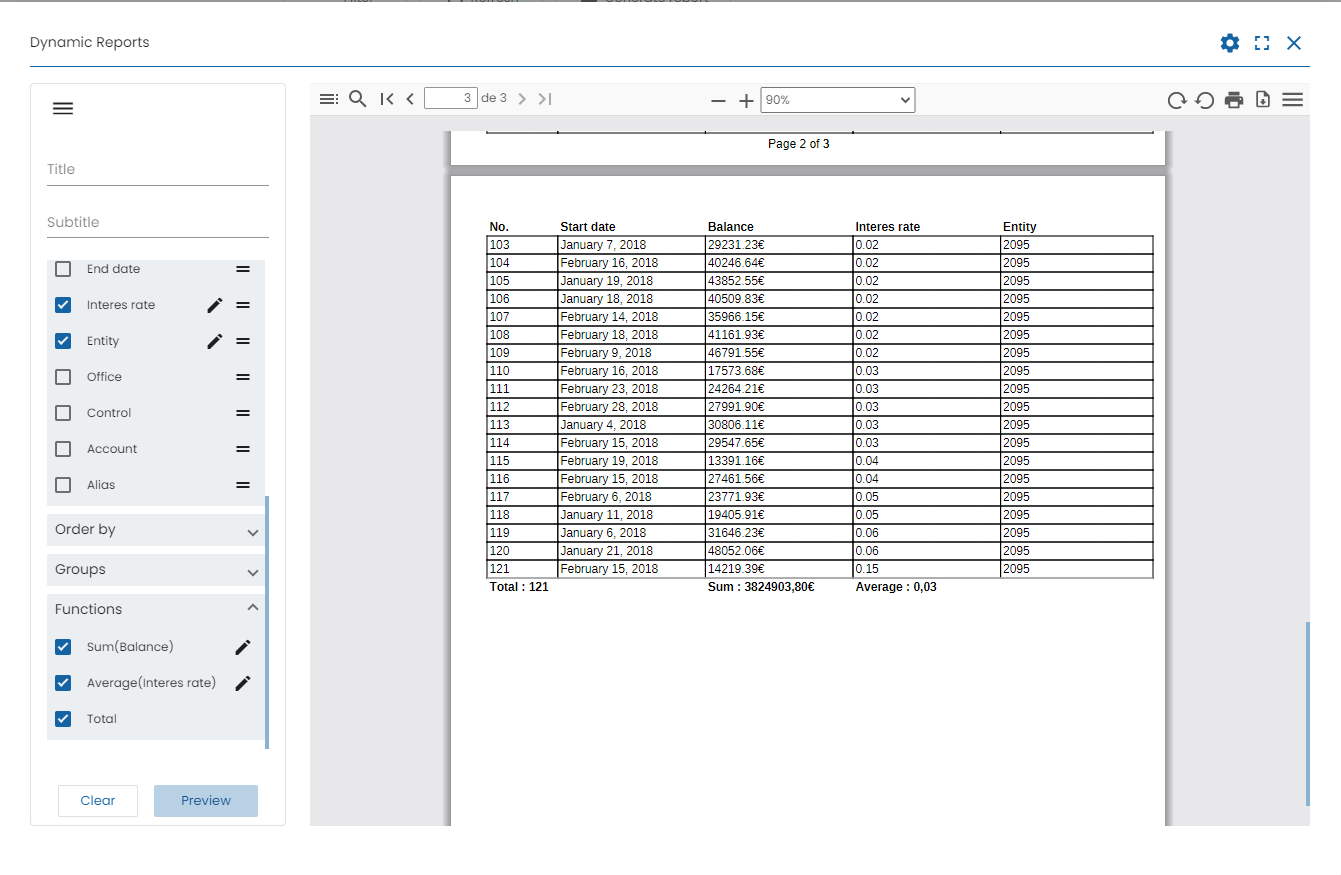
Aggregate functions example
This example shows a report with four columns, performing sum and average operations on two of them and showing the total number of rows. A style with row numbers and with a grid in the cells was also added
Save and load configuration
The example shows the dialog to save a configuration of a report
The example shows the dialog to select a previously stored configuration and perform a faster report
