Overview
Introduction
The module Ontimize Web Chart on-demand allow the final users of the applications developed with Ontimize to define, view and store charts from any table available in the application.
This visual tool will allow users to define parameters of the chart such as:
1.- Title and subtitle
2.- Type of graph (line, discretebar, multibar, area, pie, donut)
3.- Color palette for multi bar, pie and donut charts
4.- Column to display on the x-axis
5.- Column to display on the y-axis
6.- Data source (current page, filtered data, all data)
7.- Preferences (allows to save a configuration, apply an existing one or update it)
NOTE: Remember to complete the steps you need to perform on your backend server to complete the charts on-demand configuration following this link
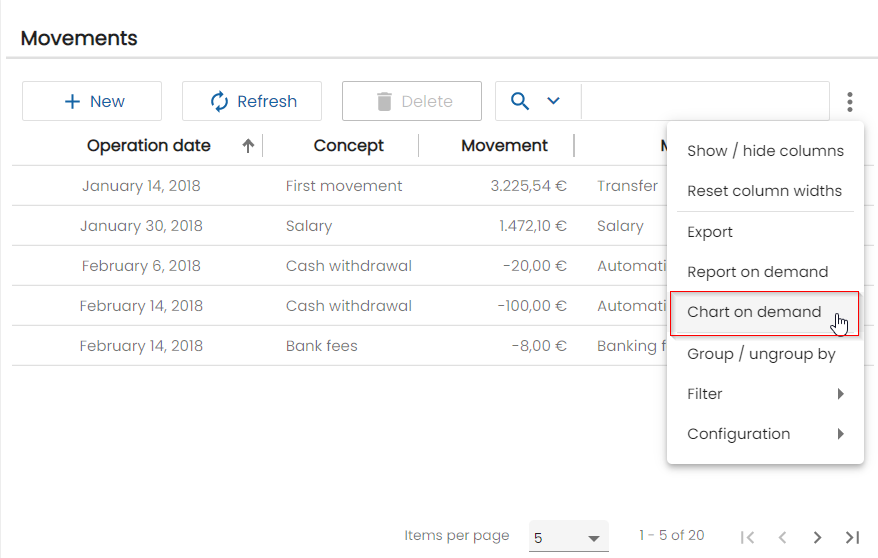
Menu option
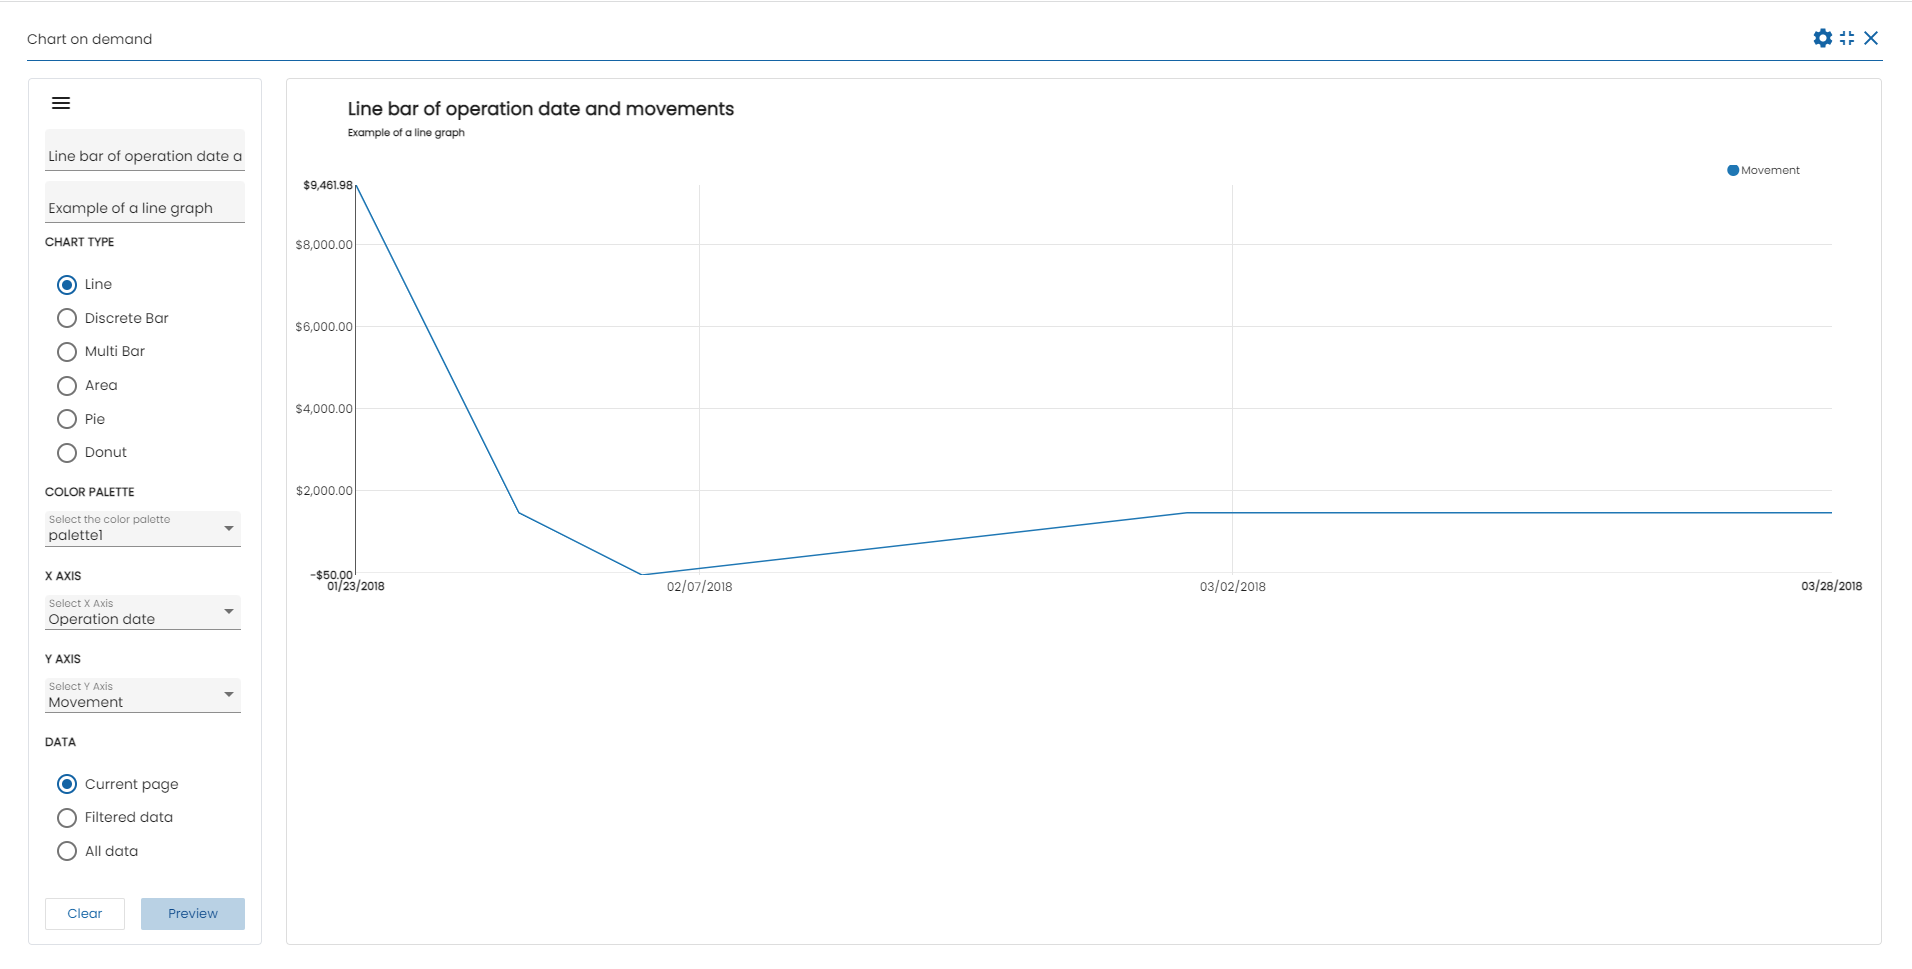
Basic example of Line chart
This basic example shows a line chart of operation date and movements
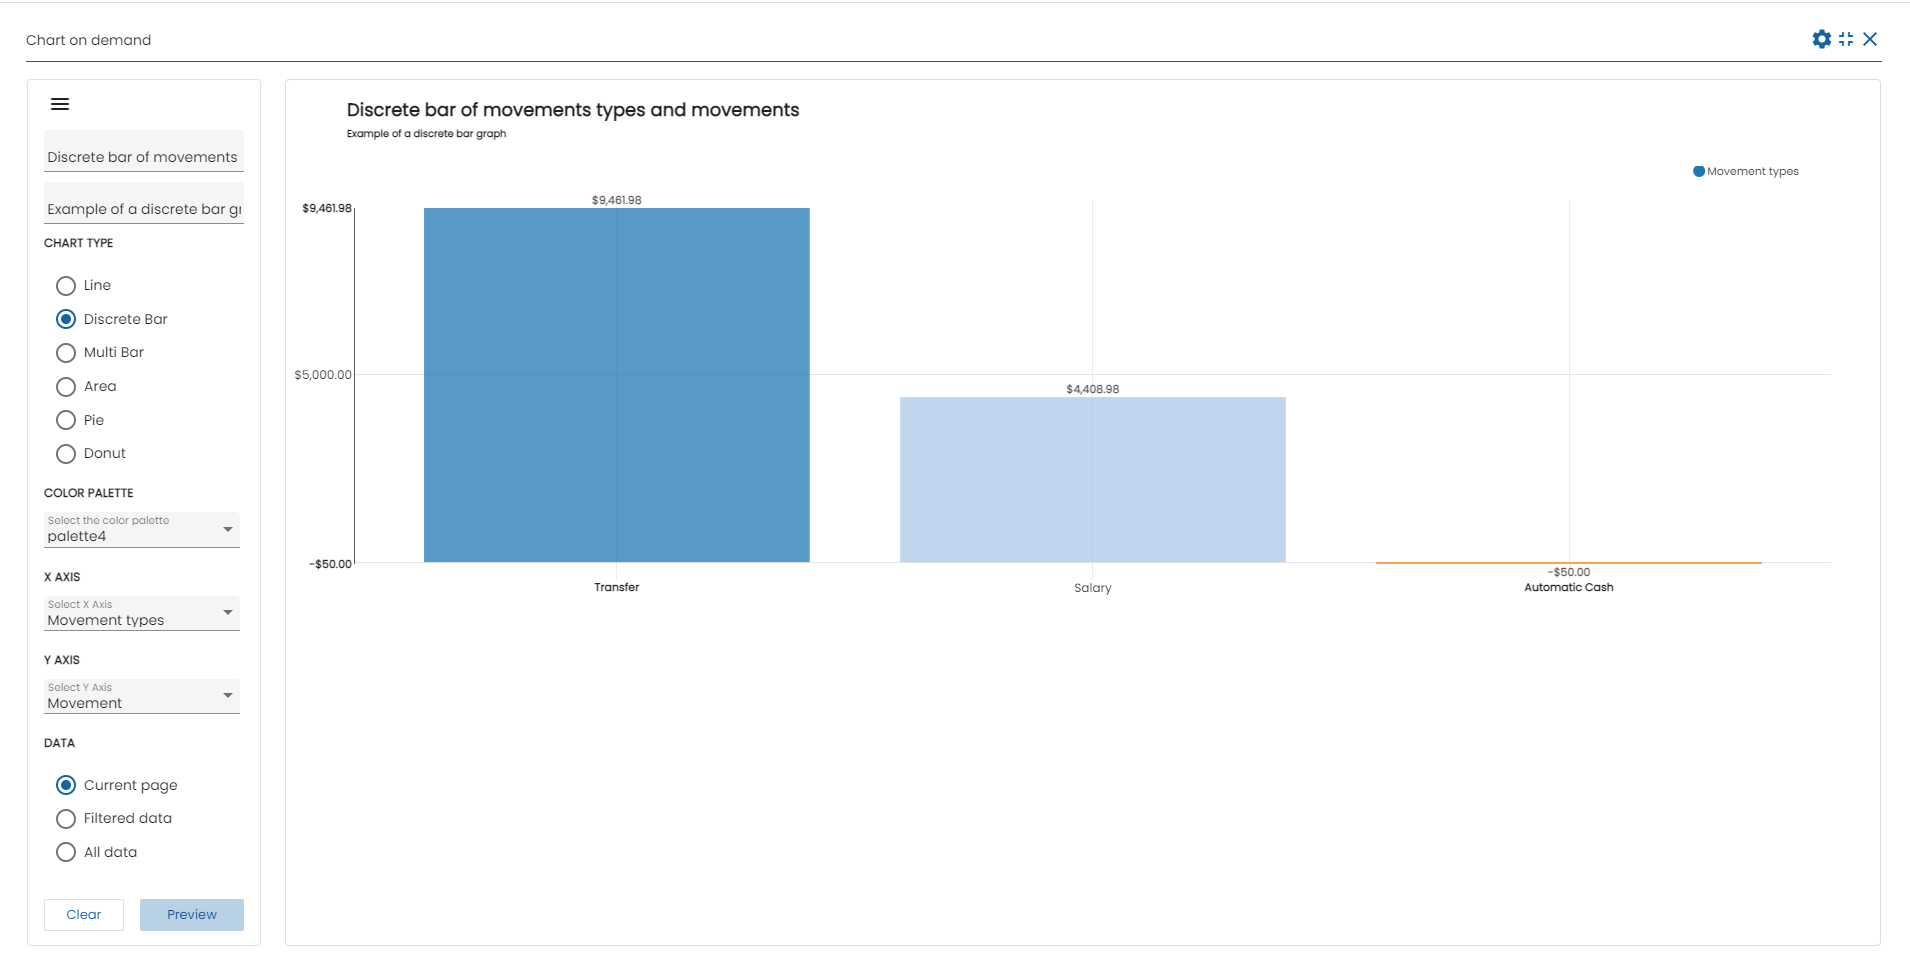
Basic example of Discrete Bar chart
This basic example shows a Discrete bar chart of movements types and movements
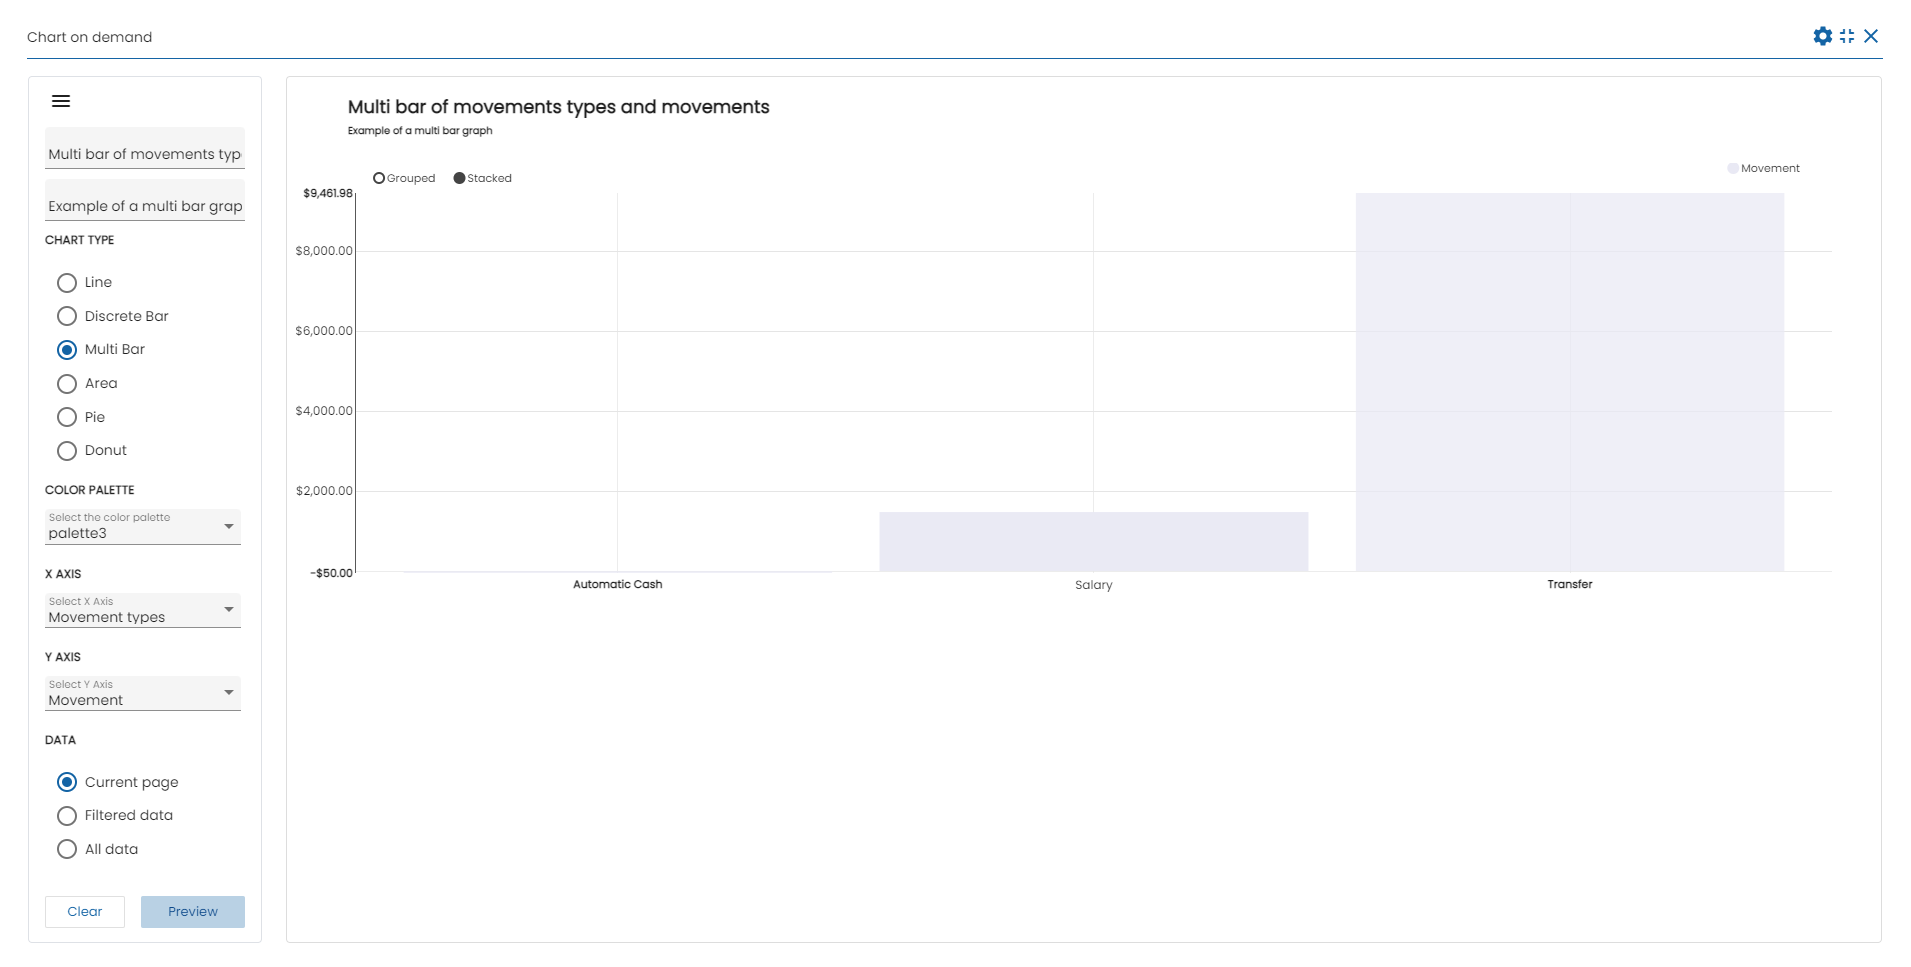
Basic example of Multi Bar chart
This basic example shows a multi bar chart of movements types and movements
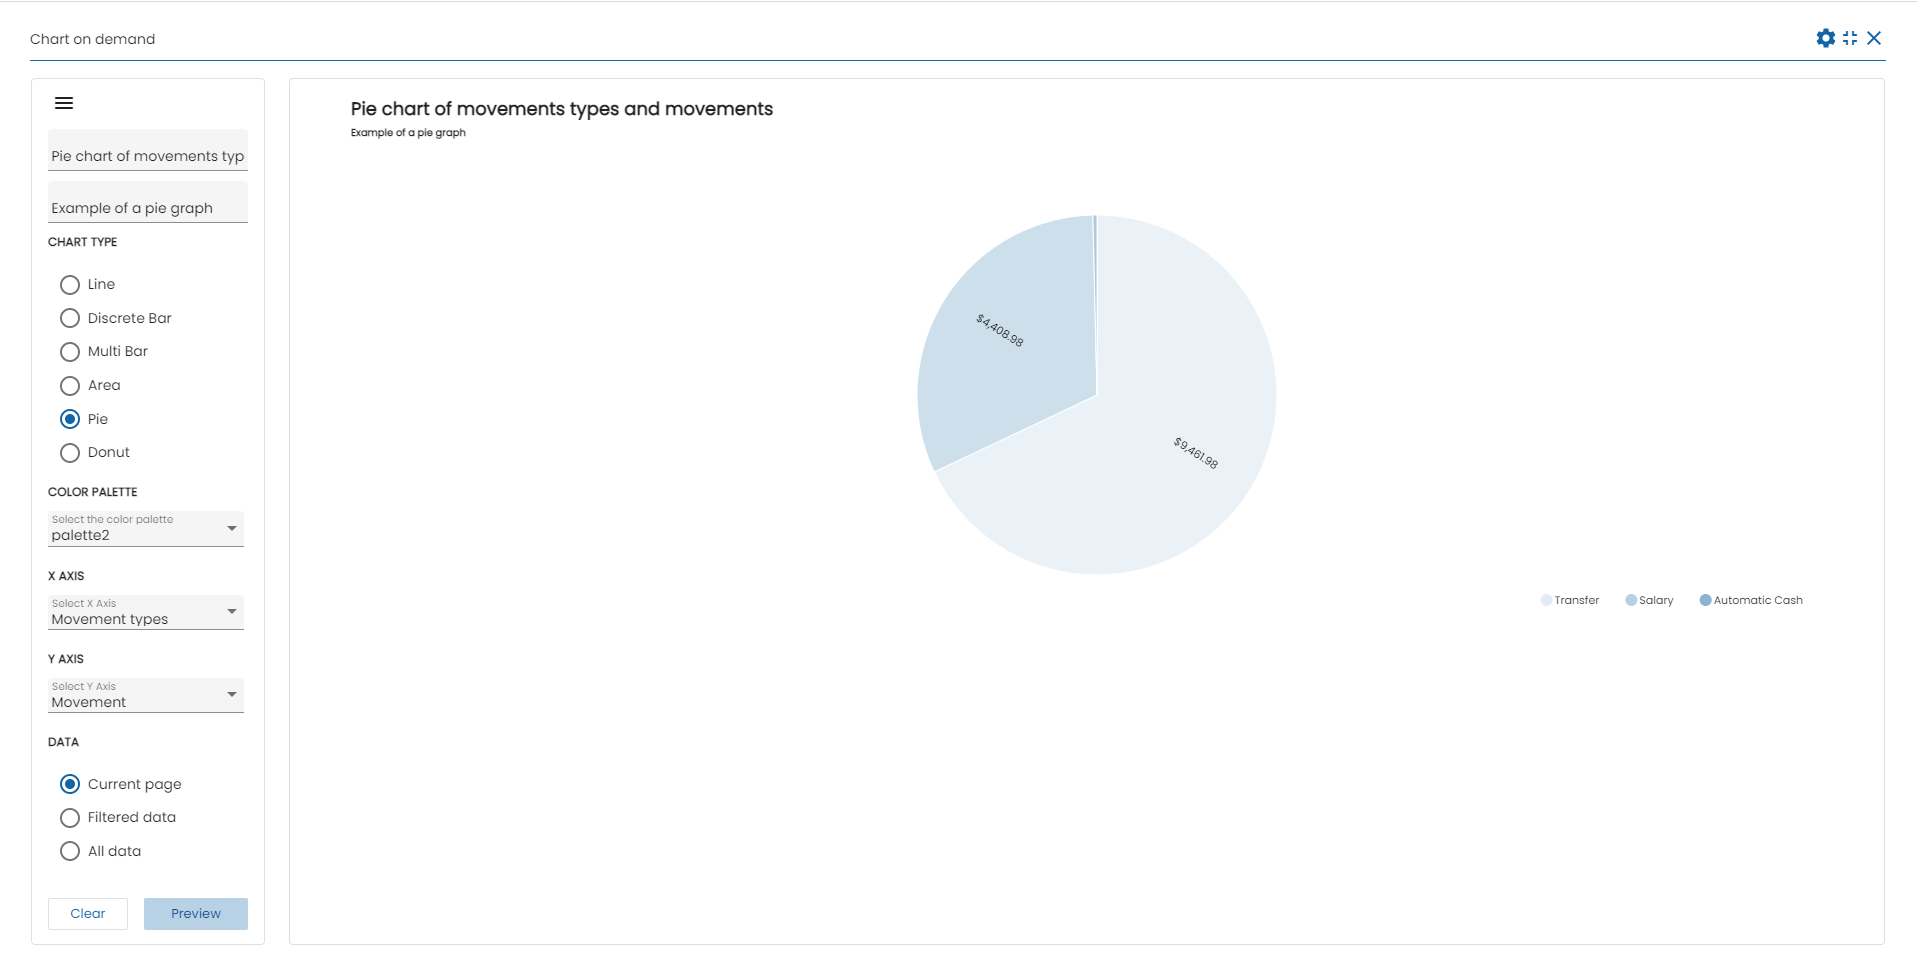
Basic example of Pie chart
This basic example shows a pie chart of customers type
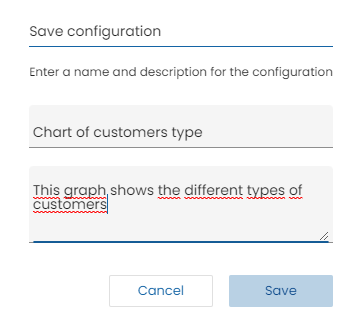
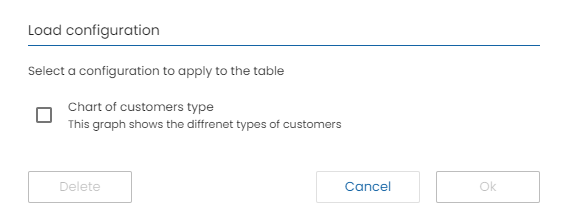
Save and load configuration
The example shows the dialog to save a configuration of a chart
The example shows the dialog to select a previously stored configuration and perform a faster chart
